SAP has created a variety of solutions like RTE dump analysis,HANA DB performance trace, expensive statement trace, and kernel profile tracer that can be used to investigate real-time performance issues in HANA DB due to elevated CPU utilization. This blog entails how to analyze past issues, and how to trace the root cause of which session from the SAP application side caused the issue.
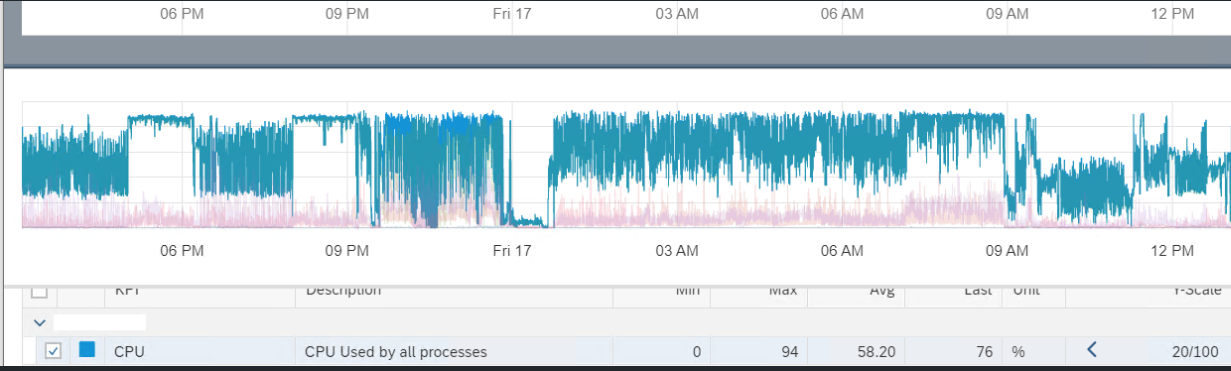
In one of the recent encounters, we had to analyze the performance issue that happened in the past. Initial investigation from the SAP application side with ST03n, STAD clearly suggested that the performance issue was on the HANA DB side.
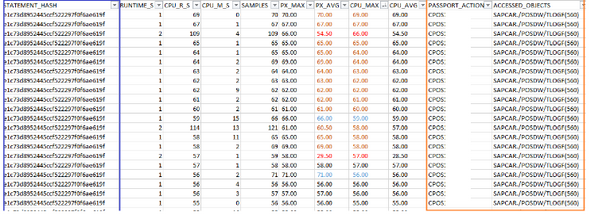
The SQL statement“HANA_Threads_ThreadSamples_StatisticalRecords_2.00.060+“ SAP note 1969700 - SQL Statement Collection for SAP HANA can be used to identify which SQL statement(s) have consumed more CPU, and from there we can backtrack to identify the respective application session.
From PX_MAX / CPU_MAX we can identify a list of SQL-statements utilizing high CPUs, in this case, we see all the sessions are from the same SQL-statement and this clearly shows that the entire CPU-load was due to that statement during the time window. It can differ from case to case, some time High CPU load can also be caused by multiple individual statements.
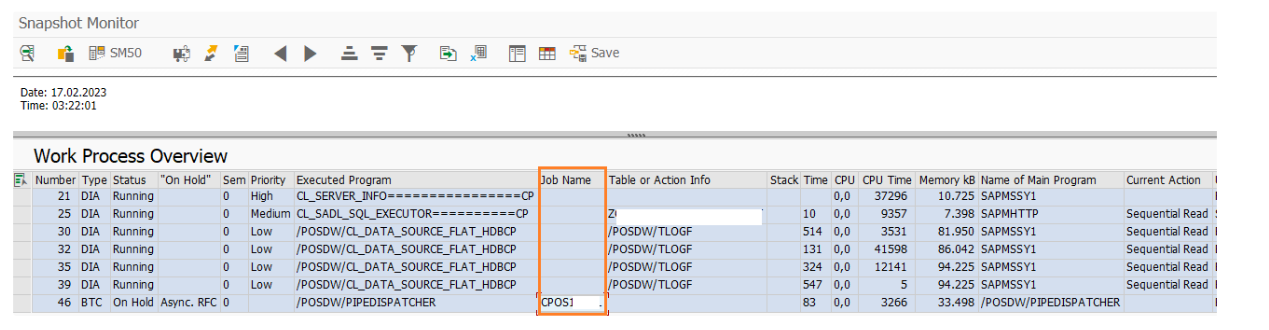
Passport_action provides information about the respective SAP application session, with the help of SDFMON we can map the respective SAP application session and conclude which DIA/BG process has triggered the DB statementWith the help of the statement ‘Hash’, we can deep dive further into analyzing based on the cache plan.
“HANA_Threads_ThreadSamples_StatisticalRecords_2.00.060+”, we can trace the SQL statements that are utilizing high CPUs and backtrack the respective SAP process with the help of SDFMON. Hope this will be handy to analyze any past dated HANA performance issues.
 Subramani RamaKrishnan